output interpretation
Results Folder
A folder will now exist at the path you provided as the result_path attribute in your User Input argument. This top-level results folder will look something like the following, depending on which settings you use:
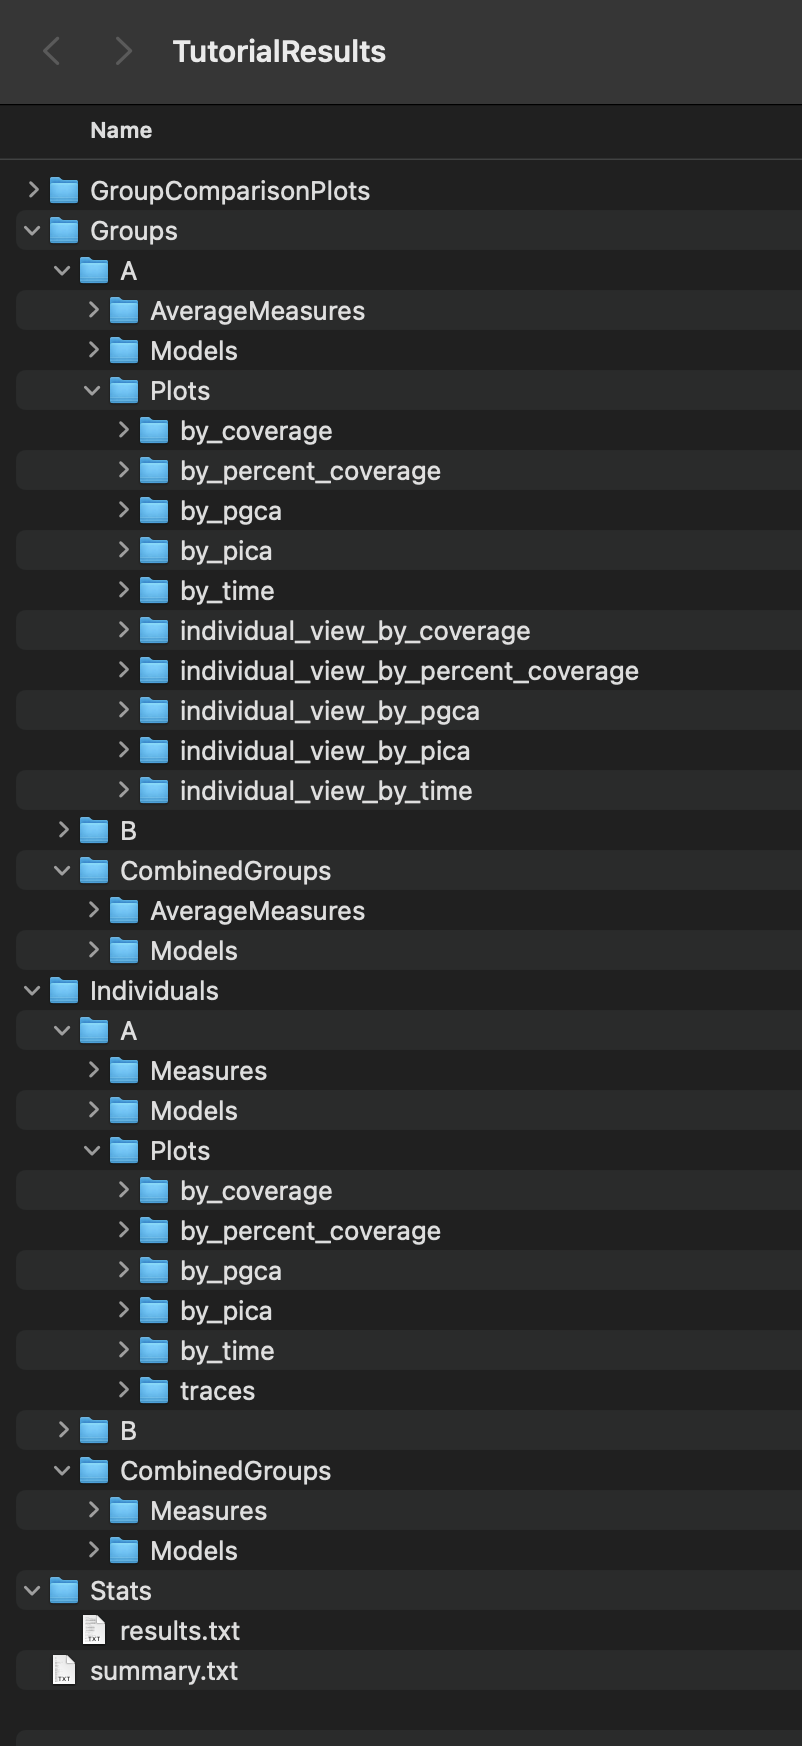
Summary of Contents:
The contents of Results -> GroupComparisonPlots -> by_m are scatter plots of all the group averages with the ‘m’ measure as the x-axis. These plots may contain error bars indicating the SEMs of the average and/or group model fits, depending on the settings used.
The contents of Results -> Groups -> CombinedGroups -> AverageMeasures are .csv files that contain the average and SEM values of a measure by a differnt, x-axis measure, for all groups.
The contents of Results -> Groups -> CombinedGroups -> Models is a .csv file that contains the group average model fit parameters for every model parameter for all groups.
The contents of Results -> Groups -> GroupName -> AverageMeasures are .csv files that contain the average and SEM values of a measure by a different, x-axis measure, for GroupName.
The contents of Results -> Groups -> GroupName -> Models is a .csv file that contains the group average model fit parameters for every model parameter for GroupName.
The contents of Results -> Groups -> GroupName -> Plots -> by_m are scatter plots of the GroupName average with the ‘m’ measure as the x-axis. These plots may contain error bars indicating the SEMs of the average and/or group model fits, depending on the settings used.
The contents of Results -> Groups -> GroupName -> Plots -> individual_view_by_m are scatter plots that contain every individuals member of GroupName’s’ scatter plot, overlaid with the scatter plot of the GroupName average values. These plots may contain error bars indicating the SEMs of the average and/or group model fits, and/or individual model fits, depending on the settings used.
The contents of Results -> Individuals -> CombinedGroups -> Measures are .csv files that contain the measure’s value at every time point for every individual in each of the groups.
The contents of Results -> Individuals -> CombinedGroups -> Models is a .csv file that contains the model fit parameters of every individual for every model parameter for all groups.
The contents of Results -> Individuals -> GroupName -> Measures are .csv files that contain the measure’s value at every time point for every individual in GroupName.
The contents of Results -> Individuals -> GroupName -> Models is a .csv file that contains the model fit parameters of every individual for every model parameter in GroupName.
The contents of Results -> Individuals -> GroupName -> Plots -> by_m are scatter plots of individuals’ measures. These plots may contain the individual’s model fit, depending on the settings used.
The contents of Results -> Individuals -> GroupName -> Plots -> traces are plots of individuals’ trajectories in the arena, with the trajectory colored by time.
The contents of Results -> Stats is a text file that contains the statistical test results of the run. See Statistics section below for more details.
The contents of top level file named summary.txt is a text file that contains information about the settings used and the data read-in during this run. It has all the information you need to re-produce the results from the same starting data.
Statistics
The statistics text file starts with a section labeled ‘Full Model MANOVA Results’. In this section you will find the results table from a MANOVA test. This model tests whether there are response variables (parameters fit on measure data) that are significanly different based on the independent variable (group). Please note that if your sample size is too small you may get invalid results because of the large number of parameters being tested.
After the Full Model section, there is a section for every model that was fit. For example, it starts with the time vs activity model. For each section there will be another MANOVA table. This table, rather than testing every parameter from every model, only tests the parameters from the specified models. For example, it only tests the 3 parameters that are needed to fit the time vs activity relationship. Following the MANOVA table, there is an ANOVA table for each parameter included in the MANOVA model, as well as a set of pairwise T-tests to identify which groups might differ from one another on that given parameter.
To identify which parameters are significantly differeny from each other, first check the full model MANOVA. If, under the ‘group’ section, Pr > F is insignificant, then none of your tests showed significant results. If this section shows a significant difference (or you are unable to test the full model), you should next look at the ANOVA table for each parameter you care about. (If you sucessfully ran the full MANOVA test, the partial MANOVAs are unneccessary, but they may be helpful to consider if your full MANOVA was invalid.) For each ANOVA table, look at the ‘group’ row for the value under PR(>F). If this value is significant, then some of your groups differ from each other for that parameter. Otherwise, continue looking at the next parameter. For each significant parameter, you then can look at the pairwise t-test results, directly under the ANOVA table. Here you can look at the reject-hs column to see which pairs of groups are significantly different. To get the p-value for this difference look at the pvalue-hs column (if there are only 2 groups), or the ___ column (if there are 3 or more groups).
Finally, I want to note that the statistical results file contains every valid combination of measures. For example, it will look for differences in the parameters from the time vs P++(Raw), time vs P++Given+, and time vs P++GivenAny models. It is best to choose which of these versions is best for your application (or likewise, which coverage measure is best for your application) before looking at the results. This significantly reduces the number of parameters you need to sort through.